Chart Wizard - Introduction
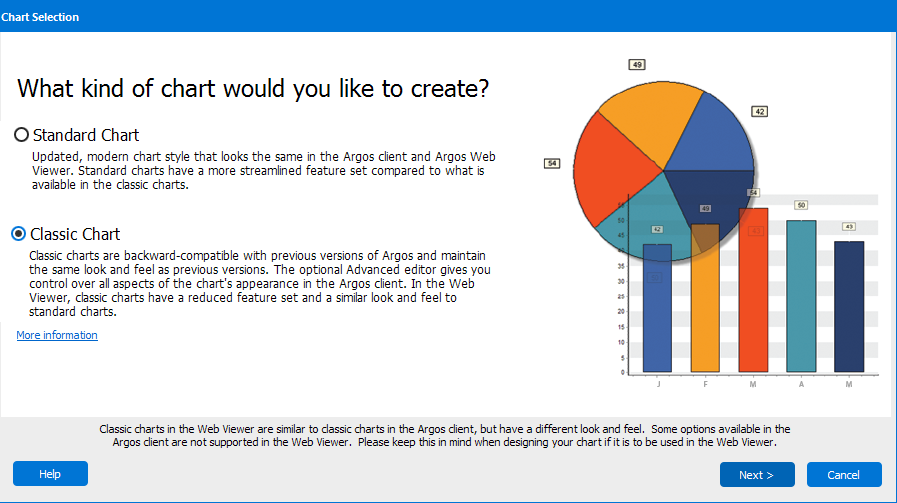
The first screen of the Chart Wizard asks you to choose a type of chart to create. Argos has two chart types, classic and standard. Standard charts were added in Argos 5.3, and provide a more modern look and feel. They also provide a more consistent view of the chart between the Argos client and Argos Web Viewer. If you're wanting to create a chart that matches earlier development, you can use a classic chart, which is the original Argos chart from previous versions.

Standard charts provide a more modern chart style than classic charts, and look similar regardless of whether you are using the Argos client or the Web Viewer.
Keep in mind that when using the Web Viewer, certain chart features, such as border styles and fonts, may render differently in different web browsers.
For more information on the specific features that are supported in each chart type, see the Charting Features page.
To build a chart in the Chart Wizard:
- Add a chart object to your form by selecting the chart icon in the toolbar and then clicking on the form where you want to place the chart.
- When the Chart Wizard opens, select the style of chart you want to create. A preview of the selected style appears to the right.
- Series Manager - Use this screen to create one or more series for your chart.
A series is any group of related data items that you want to plot on a chart. Certain types of charts can have more than one series plotted on it if you wish, such as bar, line, points, and area charts. Others, like pie and gauge charts, only show one series within each pie or gauge. However, you can add multiple series to these charts and your result will be multiple pies or gauges. - Select or create the SQL Variable that contains the data for this series in your chart.
- Select a chart type ( bar, pie, gauge, line, point, area).
- Configure chart type options.
- Configure series labels.
- Theme and Panel - Select a theme and color palette for your chart, and configure the background panel.
- Legend and Titles - Configure the chart legend and titles for various parts of the chart.
If you are creating a classic chart, the Advanced button available from the Legend and Titles screen will allow you to configure advanced charting options. You should keep in mind that many of these features are not available in the Web Viewer. You can use the Web View button in the DataBlock Design window to see how your chart will look in the Web Viewer.